View multiple readings per sample in quality checks
Quality control plans can require multiple readings per sample for a question — for example, taking three temperature measurements at different points on a batch to capture variation within the sample. After recording readings across multiple samples, an inspector may want to review how values distribute across the check as a whole: whether readings are consistent, whether a particular sample stands out, or whether there is a gradual drift across samples.
The All Measurements dialog plots all readings for a per-sample question on a line chart and shows summary statistics below. Only integer and decimal question types support this view.
View all measurements in the Quality Control App
Select the more actions icon  on a per-sample question row to open the action menu, then select Show all measurements. Show all measurements is only available for integer and decimal question types.
On posted checks, the more actions menu is not shown. Instead, a measurements icon  appears directly on the question row for any per-sample integer or decimal question. Select it to open the same All Measurements dialog.

The All Measurements dialog opens and shows a line chart with all readings for that question plotted across all samples. Each point on the line represents one recorded reading. If a reading has not been entered, a gap appears in the line at that point.
When a question allows multiple readings per sample, the x-axis labels each point by reading and sample number — for example, Reading 1 / Sample 1. When there is one reading per sample, the x-axis shows sample numbers only.
Below the chart, the following summary statistics are shown:
- Completed — the number of readings recorded out of the total expected.
- Highest — the highest recorded value.
- Average — the average of all recorded values.
- Lowest — the lowest recorded value.
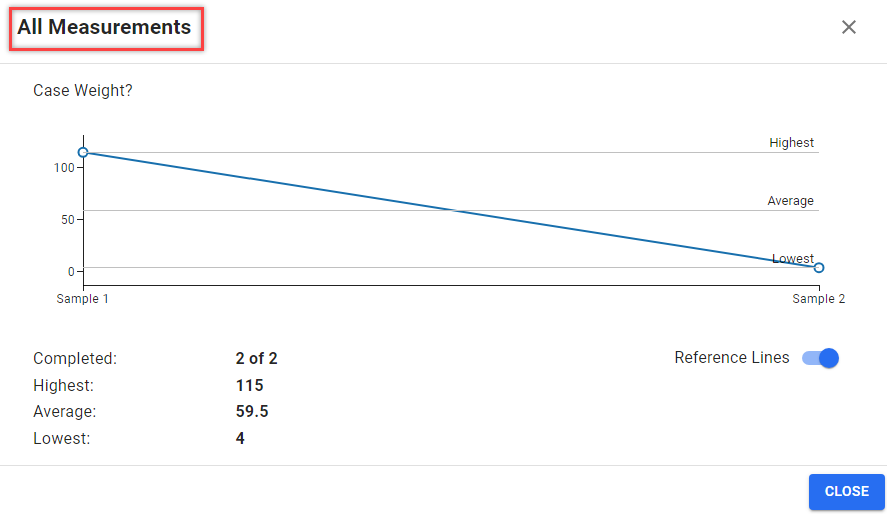
The Reference Lines toggle shows or hides horizontal reference lines for the highest, average, and lowest values on the chart. If a unit of measure is configured on the question line, it is shown alongside values on both axes.
For example, to check whether temperature readings vary significantly across samples, select the more actions icon on the temperature question row, select Show all measurements, and review the chart and the highest and lowest values in the summary.
View all measurements in Business Central
Summary statistics for the selected per-sample question line are shown in the Answers per Sample FactBox on the Quality Control Check card and the Posted Quality Control Check card. For more information, see View quality check details.